
By now the maps and charts derived from the GPS tracks that I’ve recorded have become part and parcel of the blog. The software responsible for this is GEOrgET (GoogleEarth Organiser, Editor & Toolkit). However, with the gradual publication of 1 arc second elevation data, it was time to have another look at the program to see if the greater resolution was worth accommodating.
Three areas needed reviewing: The first was cosmetic – the logos and how the program looked and felt; the second was introducing the 1 arc second data and adapting the program accordingly; and the third was the under-the-hood question of the coding.
The cosmetic improvements included the new 3D logos which were fun to design and implement. Then the program handling had to be addressed. Directory and file selection are now achieved with a single click which automatically reloads the page; and to avoid clutter the latest version of multi-version files is only ever shown, and non-editable files are never shown.
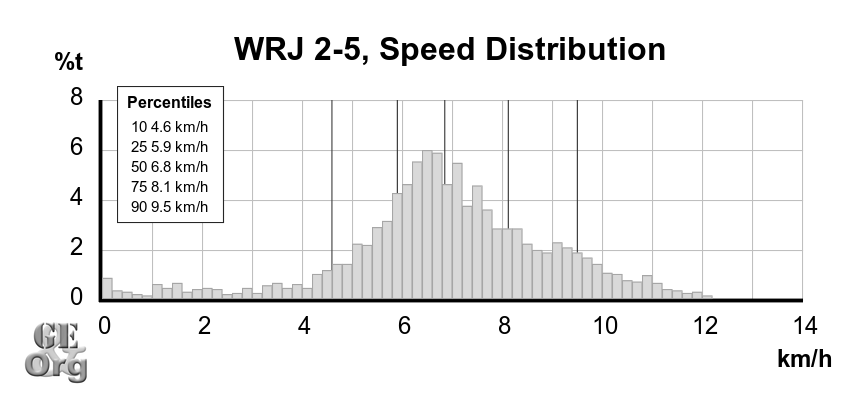
An extra pair of graphs was introduced – the speed distribution as a function of time and distance, with percentiles for 10%, 25%, 50%, 75% and 90%. The multi-day speed v time graphs now map onto one very wide graph.

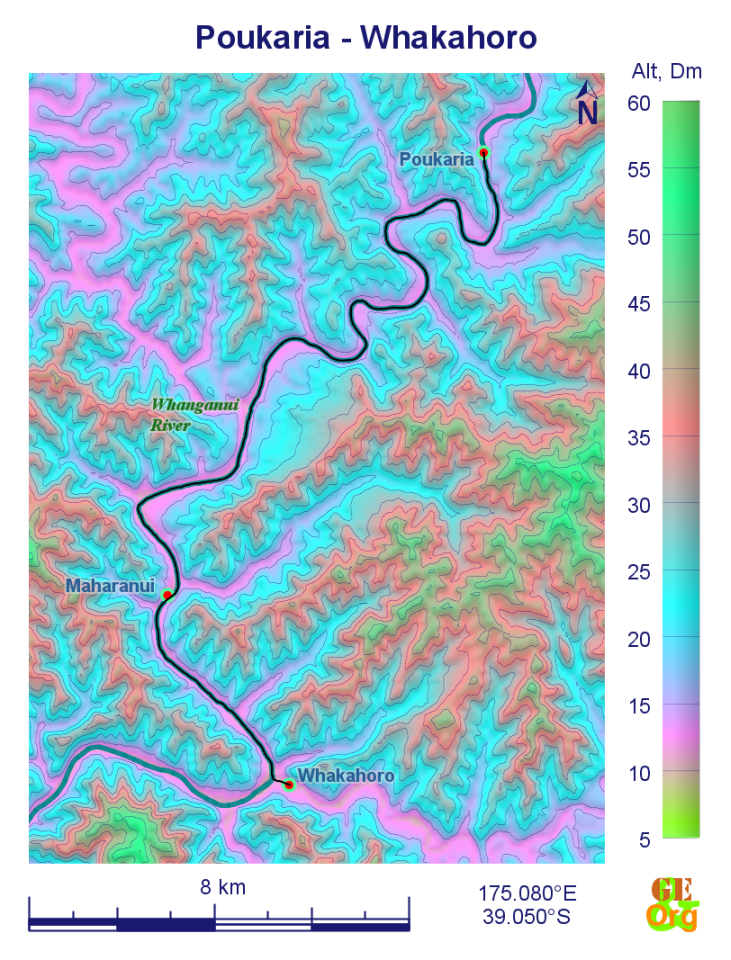
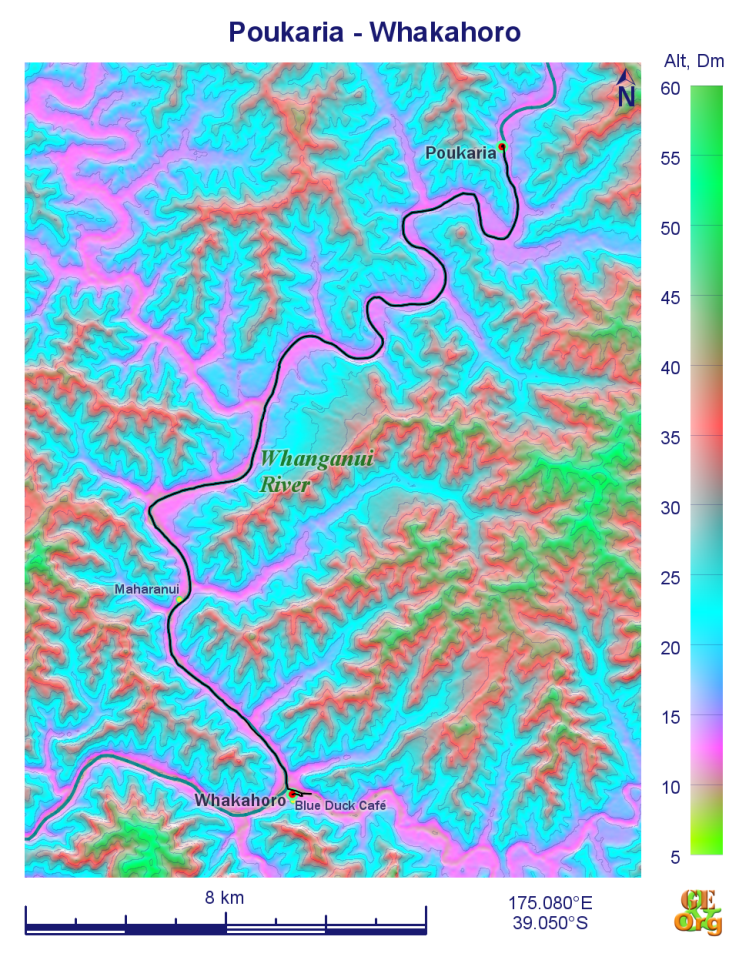
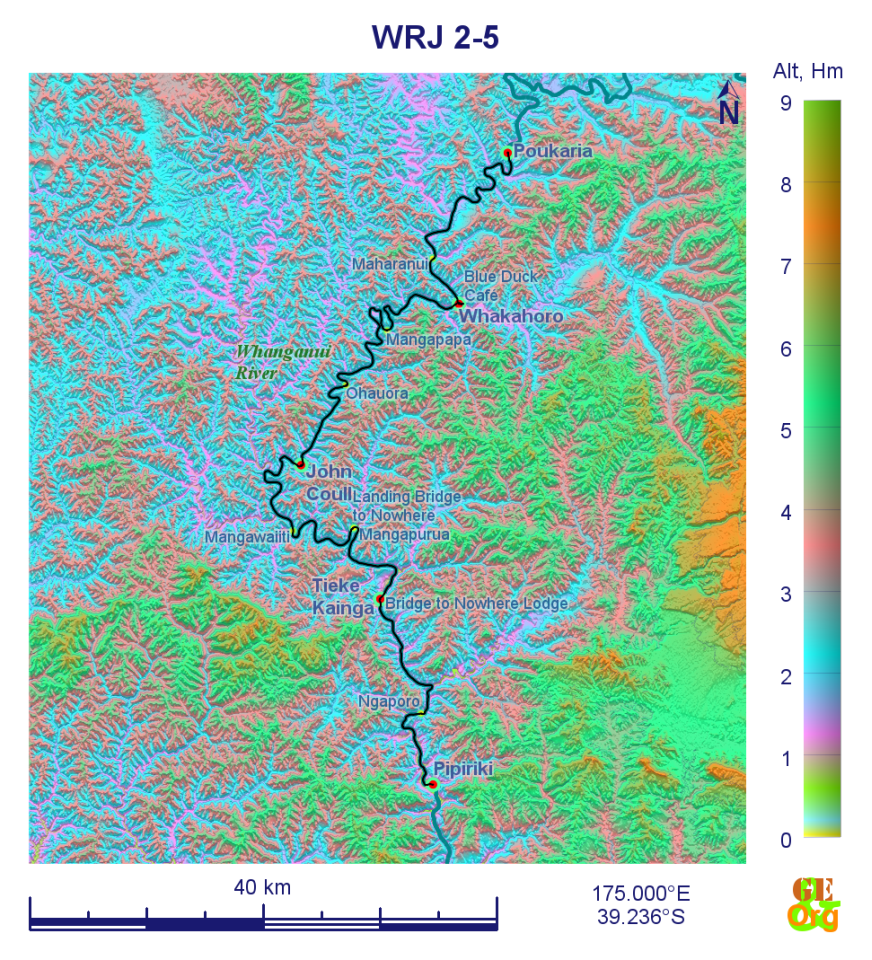
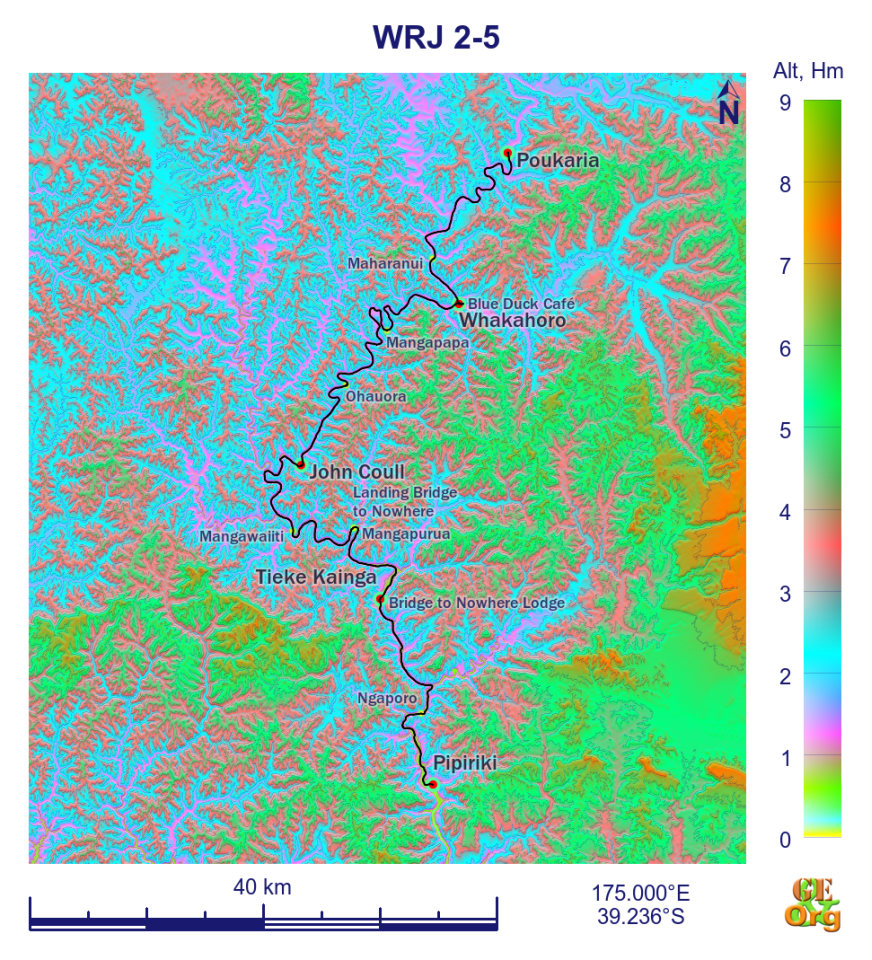
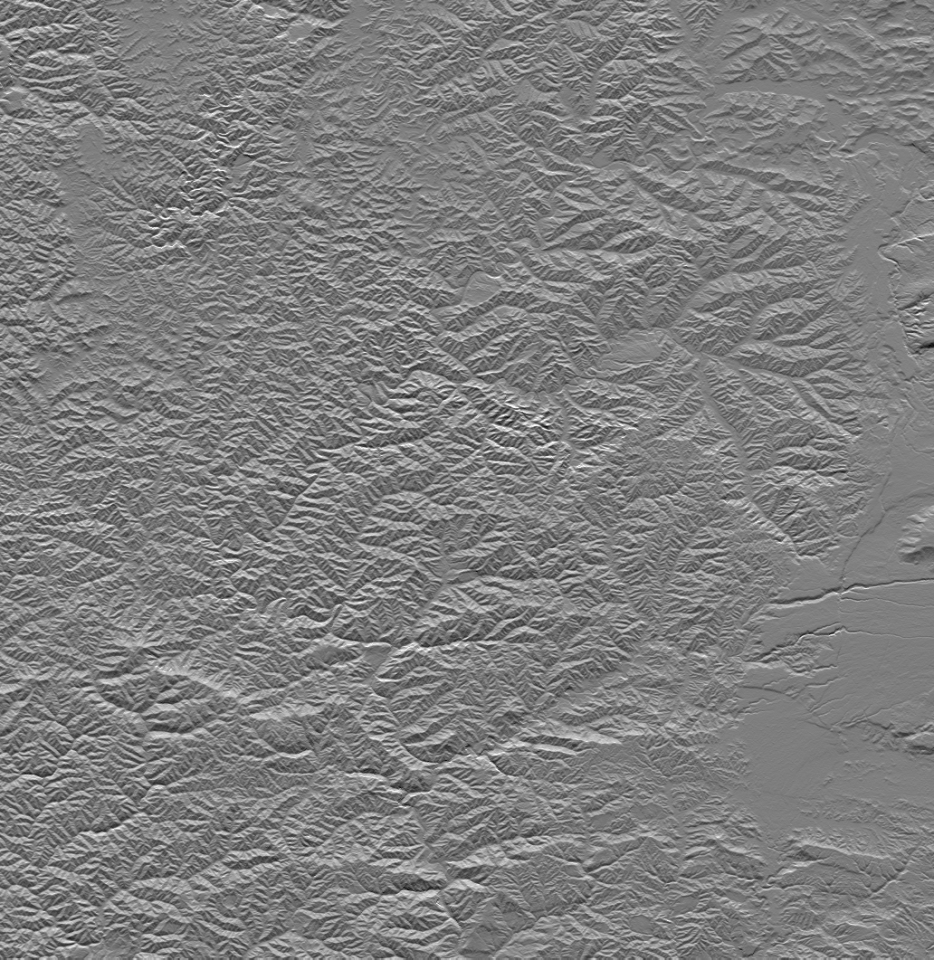
The positioning and size of place names was improved, as was the contouring to give less prominent but almost complete contours.
Finally, some technical tidying up. This version now has to work in PHP 5.4-5.6 and PHP 7.0, with its novel foreach () implementation. These versions of PHP introduce a number of new functions that were put to good use, and the code was tidied up significantly, resulting in a complete length of just under 118 kb (up from 108 kb for the last version) despite new functionality. And while doing some spring cleaning I noticed that it probably wasn’t such a good idea to unpack all of the geodata at once, especially if only two lines were needed at any one time, so I was able to put an end to this unnecessary memory loading and still have a modestly dimensioned machine produce the largest maps. Download here.

A brighter note on the graphics side. PHP’s Imagick project seems to have received a fresh lease of life, and I’ve been trying to get a few bugs fixed, with a degree of success. Good news, too, that on the official site a number of useful downloads can be found, e.g. compiled Windows binaries of current ImageMagick versions that Imagick needs, and compiled DLLs (and a whole lot of totally unnecessary stuff to boot) of the PHP extension. And one further tip: The documentation (especially the wonderful page of constants which constantly explains what an integer is) is not quite up to date, and since I believe neither in Karma nor in banishing “prepositions” from the ends of sentences I won’t be bringing it there. But a number of newly introduced and thus otherwise undocumented constants can be found from around line 950 here.
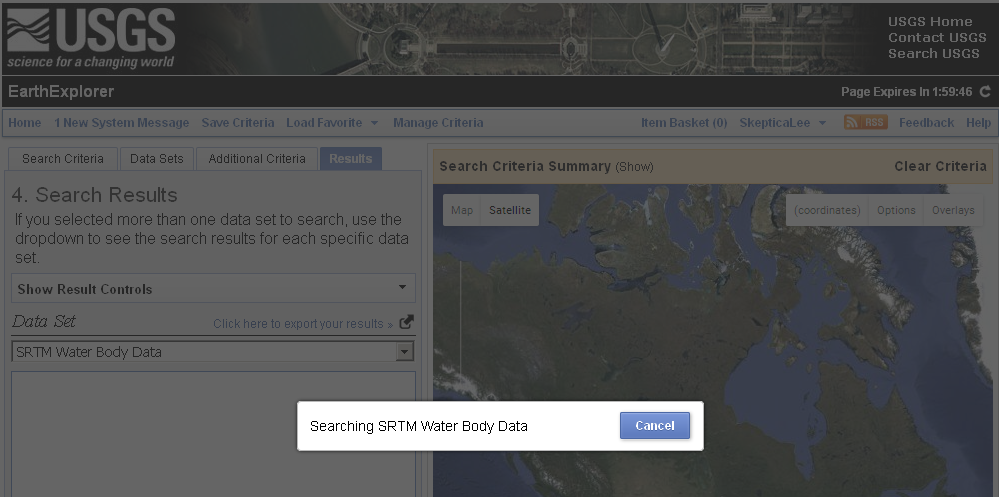
So now I look forward to the next part of the project: Mapping the water bodies. Up to now this has been done by hand (tracing), but a better solution would be, of course, being able to interpret the USGS data. And that’s the aim for GEOrgET 1.3, the next major step.